What this article covers
This analysis goes beyond ranking data to examine what visible GEO assets the top AI-recommended Influencer Marketing brands have — and which commonly prescribed tactics are absent. Over 8 weeks (April 5 through May 24, 2026), Influencer Marketing crossed from Oligopoly to Monopoly-like concentration in AI recommendations, the steepest such shift among 10 tracked SaaS categories. A May 30 site-level audit of the top 5 brands found that FAQ pages and competitor comparison pages were largely absent, while 2 of the top 5 — including the current #1 — had adopted llms.txt. These are observed asset patterns, not evidence that any single tactic drives DECA Score.Influencer Marketing is the only tracked category where the top 5 AI-recommended brands have zero dedicated competitor comparison pages — and only 1 of 5 maintains a FAQ page. The brands leading AI recommendations arrived there without the most commonly prescribed GEO tactics.
The concentration data: from Oligopoly to Monopoly in 8 weeks
The Gini coefficient measures how unevenly AI recommendation weight is distributed among brands. Applied to DECA Score distributions within a category, it quantifies concentration: 0 means all brands are recommended equally, 1 means one brand captures everything. Values above 0.73 indicate Monopoly-like concentration in AI recommendations — this does not refer to commercial market share or legal market dominance. Influencer Marketing’s Gini increased in 6 out of 8 weeks, with an overall slope of +0.0071 per week — the steepest positive trend among all 10 tracked categories.| Week | Gini | AI Vis Rate | #1 Brand (DECA) | #2 Brand (DECA) | #3 Brand (DECA) |
|---|---|---|---|---|---|
| W1 | 0.693 | 12.7% | CreatorIQ (100.0) | GRIN (82.6) | Aspire (60.6) |
| W2 | 0.725 | 14.9% | CreatorIQ (100.0) | GRIN (81.0) | Aspire (62.5) |
| W3 | 0.676 | 12.1% | CreatorIQ (100.0) | GRIN (76.8) | Traackr (61.9) |
| W4 | 0.645 | 9.4% | CreatorIQ (100.0) | Aspire (85.6) | Traackr (62.3) |
| W5 | 0.714 | 11.8% | CreatorIQ (100.0) | Aspire (83.3) | Traackr (54.8) |
| W6 | 0.740 | 16.5% | CreatorIQ (100.0) | Aspire (95.2) | Later (58.3) |
| W7 | 0.722 | 12.4% | Aspire (100.0) | CreatorIQ (99.6) | Traackr (48.5) |
| W8 | 0.743 | 15.4% | Aspire (100.0) | CreatorIQ (98.6) | Traackr (56.0) |
Is your category concentrating?
If your market is moving toward Monopoly-like AI recommendation concentration, timing matters. DecaGEO tracks whether your brand is gaining, losing, or stuck outside the AI recommendation pool. Track your category on DecaGEO →What the top brands actually do — and what they don’t
Ranking data shows who is winning. A site-level audit shows what the winners are doing. DecaGEO audited the GEO-relevant assets of the top 5 Influencer Marketing brands by W8 DECA Score: Aspire, CreatorIQ, GRIN, Traackr, and Later. The audit checked only visible, site-level assets available on May 30, 2026. It did not measure backlink profiles, review velocity, content quality, third-party mentions, or when each asset was first implemented. Visible assets that are mostly absent among current leaders:- FAQ pages: Only 1 of the top 5 brands (GRIN) maintains a dedicated FAQ page. Aspire (#1), CreatorIQ (#2), Traackr (#3), and Later have no FAQ page. This is notable because FAQ coverage is one of the most frequently cited GEO recommendations.
- Competitor comparison pages: 0 of the top 5 brands have dedicated “vs” or comparison pages. No “Aspire vs CreatorIQ,” no “CreatorIQ vs GRIN,” no alternatives pages. This is another widely prescribed GEO tactic that the current leaders have not adopted.
- AI-specific sitemap-like files: 0 of 5 brands have separate AI-oriented sitemap files (such as ai-sitemap.xml or llms-sitemap.xml). This category is not a mature standard, so absence should not be interpreted as a best-practice failure. All maintain standard XML sitemaps. One brand (GRIN) has an outdated sitemap from 2019 that is not referenced in its robots.txt.
- AI-specific landing pages: No top brand has created pages specifically targeting AI recommendation queries.
- Aspire (#1 by DECA Score) has a structured llms.txt file containing brand summary, platform pages, blog content, guides, courses, events, and case studies.
- GRIN (formerly #2, now outside top 3) has a comprehensive llms.txt with brand summary, differentiators, use cases, competitor context, source-of-truth URLs, and explicit instructions for LLM systems.
- CreatorIQ, Traackr, and Later have no llms.txt.
| GEO asset | Aspire (#1) | CreatorIQ (#2) | GRIN (ex-#2) | Traackr (#3) | Later |
|---|---|---|---|---|---|
| FAQ page | No | No | Yes | No | No |
| Comparison pages | No | No | No | No | No |
| llms.txt | Yes | No | Yes | No | No |
| AI sitemap | No | No | No | No | No |
| Standard sitemap | Yes | Yes | Outdated | Yes | Yes |
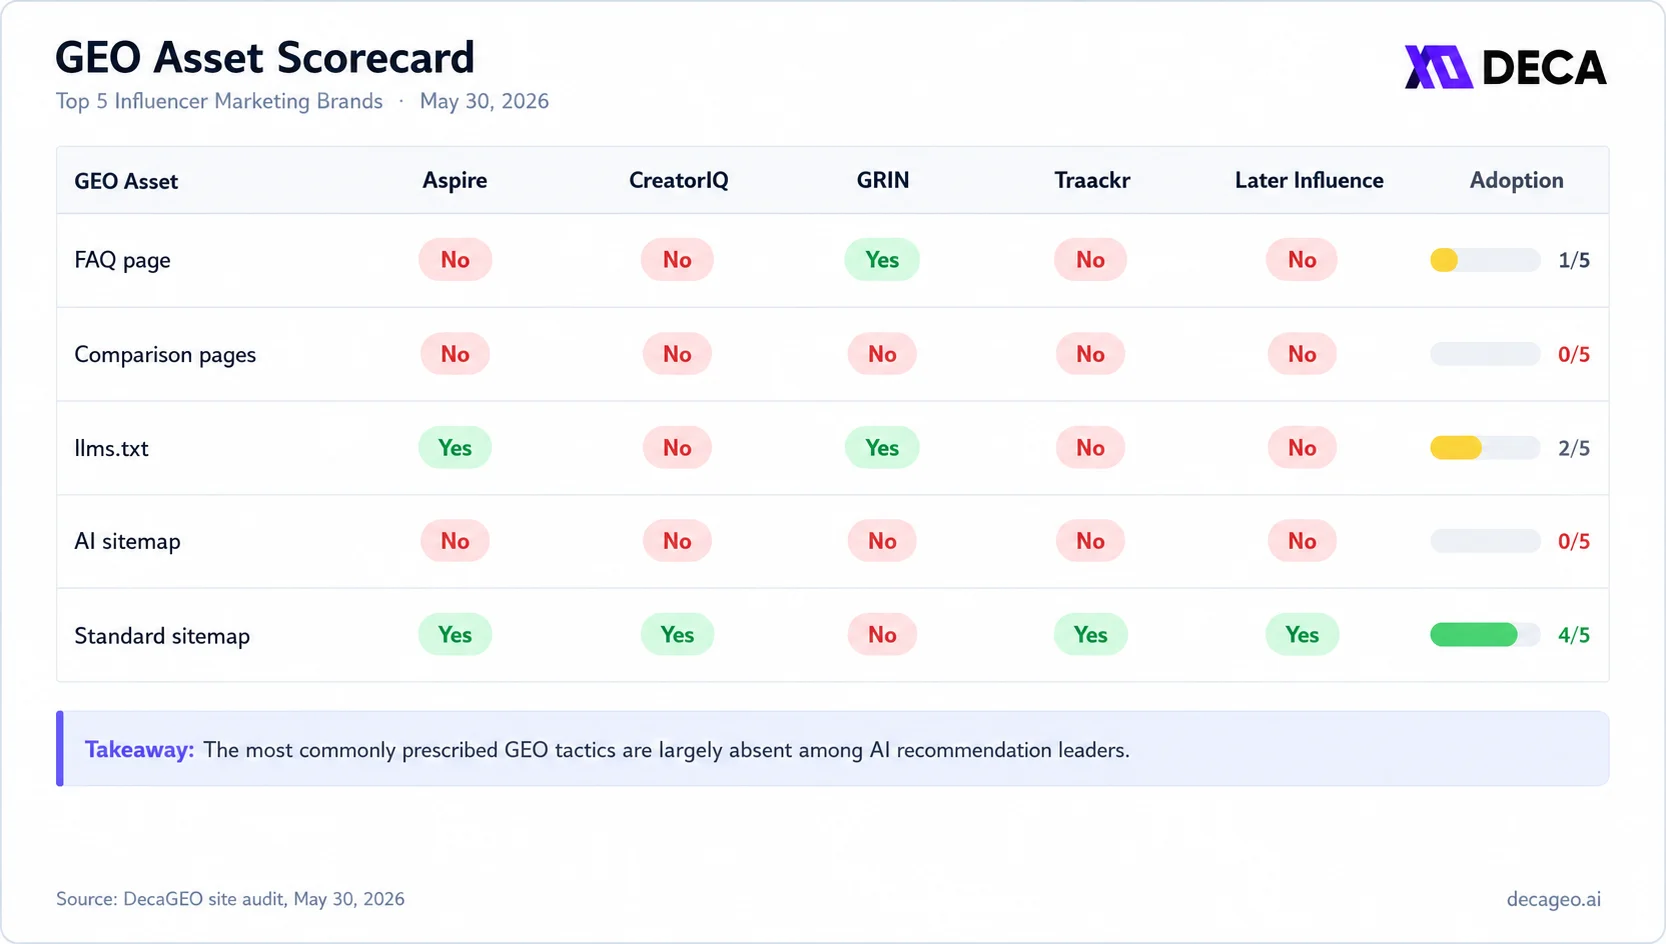
The gap between conventional advice and actual adoption
In this article, “conventional GEO advice” refers to frequently repeated tactical recommendations such as adding FAQ content, creating competitor comparison pages, publishing machine-readable AI files, and expanding answer-style content. This advice is widely shared across industry blogs, conference talks, and GEO tool marketing. The Influencer Marketing data reveals a disconnect. The most commonly prescribed tactics — FAQ and comparison pages — are largely absent among the top-ranked brands. Meanwhile, llms.txt, which receives less attention in mainstream GEO discussions, has been adopted by 2 of the top 5, including the current #1. This observation does not mean FAQ and comparison pages are ineffective. It means that in Influencer Marketing, the brands currently winning AI recommendations arrived at their positions without them. The factors driving their recommendation strength appear to lie elsewhere — possibly in review platform authority, brand recognition, or the breadth of third-party mentions. The finding also complicates the notion of a universal GEO playbook. What works in one category may not predict what works in another. The 8-week cross-category analysis shows structurally different dynamics across all 10 tracked categories, and this GEO audit suggests the strategy patterns behind those dynamics are equally varied.Observed pattern, not causation
This audit identifies visible website assets among the current top AI-recommended Influencer Marketing brands. It does not prove that any single asset — FAQ pages, comparison pages, llms.txt, or sitemaps — caused a brand’s DECA Score. The pattern is useful because it shows what current leaders have and do not have. But the likely drivers of recommendation strength may include broader authority signals such as review platform presence, brand recognition, third-party mentions, content quality, and category relevance.A counterintuitive detail: GRIN has llms.txt and FAQ — but fell out of the top 3
GRIN is the only brand in the top 5 that maintains both a dedicated FAQ page and a comprehensive llms.txt file. Its llms.txt includes competitor disambiguation, terminology clarifications, and explicit LLM instructions — the most detailed implementation among the audited brands. Despite this, GRIN held a stable #2 position in W1 (82.6) and W2 (81.0), then dropped out of the top 3 in W4 — the first full data collection week after GPT-5.5’s release — and did not return. Aspire, which overtook both GRIN and eventually CreatorIQ to reach #1, has llms.txt but no FAQ page, no comparison pages, and no AI-specific sitemaps. This pattern resists simple interpretation. Having the most GEO assets does not guarantee the highest DECA Score. GRIN’s fall and Aspire’s rise occurred despite GRIN having a more comprehensive GEO asset portfolio. Other factors — review platform authority, brand positioning, product-market fit as perceived by AI models — may carry more weight than specific GEO implementations.The leadership flip: how Aspire overtook CreatorIQ
CreatorIQ maintained a DECA Score of 100.0 for 6 consecutive weeks (W1-W6). In W7, Aspire reached 100.0 for the first time, and CreatorIQ dropped to 99.6. By W8, positions stabilized with Aspire at 100.0 and CreatorIQ at 98.6. Aspire’s rise was gradual, then sudden:- W1: 60.6 (#3)
- W4: 85.6 (#2) — jumped from #4, coinciding with the GPT-5.5 transition
- W6: 95.2 (#2) — closing the gap
- W7: 100.0 (#1) — overtook CreatorIQ
Why AI recommendations concentrate: the structural feedback loop
Research provides structural context for why categories like Influencer Marketing tend toward concentration. A 2026 analysis found that authoritative “best of” lists — rankings from G2, Capterra, and industry publications — drive approximately 41% of AI product recommendations (Onely). Separately, a study found that AI-recommended items accumulate an average of 3.6x more reviews than non-recommended items, though this finding originates from restaurant recommendation data and its direct applicability to SaaS categories has not been independently confirmed (Onely). This suggests a potential feedback loop:- Brand appears on authoritative “best of” lists
- AI references these lists and recommends the brand more frequently
- AI recommendation drives traffic, generating more reviews
- More reviews strengthen position on “best of” lists
- Return to step 1
Compare your category’s GEO pattern
Influencer Marketing leaders concentrate without consistently using the same visible GEO assets. See whether your category follows the same pattern — or whether different assets correlate with AI recommendation strength. See category GEO patterns on DecaGEO →Help Desk: same concentration, open question on GEO choices
Help Desk’s Gini rose from 0.735 to 0.750 over 8 weeks (slope +0.0057/week), making it the second-fastest concentrating category. Freshworks held DECA Score 100.0 across all 8 weeks. This suggests a next research question: do concentrating markets share the same visible GEO assets, or does each category concentrate through different authority signals? DecaGEO will compare Help Desk and Influencer Marketing GEO asset patterns in the next category deep dive.What concentration means when AI referrals convert at higher rates
On May 7, 2026, OpenAI’s Branded Link Update increased B2B SaaS referral traffic from ChatGPT by more than 200% (Profound). Industry reports indicate that AI-referred visitors convert at meaningfully higher rates than traditional organic search traffic. DecaGEO measures recommendation structure, not traffic — these referral figures provide business context from external sources. In a concentrating market, this referral traffic flows disproportionately to top-ranked brands. As of W8, Aspire (100.0) and CreatorIQ (98.6) together hold a combined recommendation share that dwarfs the rest of the field. The 42.6-point gap between #2 and #3 translates into a meaningful difference in which brands receive AI-driven referral traffic.FAQ
What GEO strategies do top Influencer Marketing brands actually use?
A site-level audit of the top 5 brands reveals a pattern that diverges from common GEO advice. Only 1 of the top 5 brands (GRIN) has a dedicated FAQ page. None have competitor comparison pages. However, 2 of 5 — including #1 Aspire — have adopted llms.txt, a text file placed on a website to make structured brand and content information available in a machine-readable format. The current leaders may be benefiting from broader authority signals such as review platform presence and brand recognition, but this audit did not directly measure those drivers.Do top Influencer Marketing brands use llms.txt?
Yes — 2 of the top 5 brands have llms.txt files. Aspire (#1 by DECA Score) has a structured llms.txt covering brand summary, platform pages, and content. GRIN has the most comprehensive implementation, including competitor disambiguation and explicit LLM instructions. CreatorIQ (#2), Traackr (#3), and Later do not have llms.txt. Notably, having llms.txt does not guarantee a top DECA Score — GRIN has the most detailed llms.txt but fell out of the top 3 after GPT-5.5’s release.Do top Influencer Marketing brands have FAQ pages?
Mostly no. Of the top 5 brands audited, only GRIN maintains a dedicated FAQ page at grin.co/faqs. Aspire (#1), CreatorIQ (#2), Traackr (#3), and Later have no FAQ page. This is notable because FAQ coverage is one of the most frequently recommended GEO strategies. In Influencer Marketing, the brands AI recommends most reached their positions without it.Is it too late for a new brand to get recommended in Influencer Marketing?
The structural window is narrowing. AI Visibility Rate was 15.4% in W8, meaning approximately 56 of 363 listed brands still appeared in AI recommendations. However, the Gini trend (+0.0071/week) indicates that recommendation weight is increasingly concentrated at the top. Research suggests that building review platform authority — particularly appearing on authoritative “best of” lists that reportedly influence approximately 41% of AI recommendations — may be a structural prerequisite.Can a brand break into a concentrating AI recommendation market?
Aspire’s trajectory offers a data point: it rose from #3 (DECA 60.6) in W1 to #1 (DECA 100.0) in W7. However, Aspire was already a G2 Grid leader with established review presence. Its rise was from mid-tier to top-tier within the recommendation pool, not from outside it.Why did the #1 brand change even while the market was concentrating?
Concentration and leadership change are not mutually exclusive. The market concentrated around two brands (CreatorIQ and Aspire), with both increasing their scores relative to the rest of the field. Aspire’s overtaking of CreatorIQ was a shift within the top tier, not a disruption of the concentration structure. The Gini continued rising because the gap between the top 2 and everyone else widened.What is the Gini coefficient in this context?
Applied to DECA Score distributions, the Gini coefficient measures how unevenly AI recommendation weight is distributed among brands within a category. A Gini of 0 means all brands receive equal recommendation weight; a Gini of 1 means complete concentration in one brand. Influencer Marketing’s Gini rose from 0.693 to 0.743, crossing the 0.73 threshold that marks Monopoly-like concentration. This measures AI recommendation structure, not commercial market share.Does llms.txt improve AI recommendation rankings?
This audit cannot prove that llms.txt improves AI recommendation rankings. Two of the top five Influencer Marketing brands had llms.txt files at the time of audit, including #1 Aspire, but GRIN had the most comprehensive llms.txt implementation and still fell out of the top three. llms.txt may help make brand information more machine-readable, but DecaGEO’s data does not show it is sufficient or causal.Are FAQ pages and comparison pages useless for GEO?
No. This audit only shows that current Influencer Marketing leaders reached top AI recommendation positions without consistently using dedicated FAQ or competitor comparison pages. It does not mean those assets are ineffective. Their value may vary by category, search intent, brand authority, and how AI systems retrieve and synthesize information.Does having more GEO assets guarantee higher AI recommendation scores?
The data suggests not. GRIN maintains both a dedicated FAQ page and the most comprehensive llms.txt file among the top 5 brands, yet it fell from #2 to outside the top 3 after GPT-5.5’s release. Aspire, with fewer GEO assets (llms.txt but no FAQ or comparison pages), overtook both GRIN and CreatorIQ. The relationship between specific GEO implementations and DECA Score appears to be mediated by other factors, including review platform authority and brand recognition.Methodology
Data source: DECA Score index, Influencer Marketing category on G2. Recommendations collected from ChatGPT (GPT-5.4 for W1-W3, GPT-5.5 for W4-W8), US region, weekly frequency. Model labels reflect the visible model identifier in ChatGPT at the time of each collection, not independently verified model versions. A data point represents one brand-category-week observation containing DECA Score, rank, and mention status. Tracking period: 8 consecutive weeks, April 5 through May 24, 2026 (W1-W8). Category scope: 363 brands listed on G2 under Influencer Marketing as of May 19, 2026. For comparability across weeks, AI Visibility Rate uses this count as a fixed denominator across the W1-W8 analysis. GEO asset audit: Conducted May 30, 2026. Checked for FAQ pages, competitor comparison pages, llms.txt, AI-specific sitemaps, and standard XML sitemaps across the top 5 brands by W8 DECA Score. Audit reflects the state of each website at the time of checking and may not reflect the state during the W1-W8 tracking period. Market type classification: Monopoly-like (Gini >= 0.73), Oligopoly (0.65-0.73), Distributed (< 0.65). These classifications describe AI recommendation concentration, not commercial market structure. External research cited:- Onely (2026): “Best of” list influence on AI recommendations (41%), review accumulation effect (3.6x — originating from restaurant recommendation data)
- UNSW BusinessThink (2026): ChatGPT abstraction bias (desirability over feasibility)
- Profound (2026): ChatGPT Branded Link Update, B2B SaaS referral traffic +200%
- The GEO asset audit reflects the current state of each website and cannot confirm when specific assets (llms.txt, FAQ pages) were implemented — some may have been added after the W1-W8 tracking period
- GEO strategy pattern observations are correlational, not causal
- The 3.6x review accumulation finding originates from restaurant recommendation data; its applicability to SaaS categories has not been independently confirmed
- 8 weeks may not be sufficient to confirm whether concentration is permanent or transitional
- Tracking covers ChatGPT only; other AI systems may show different patterns
- DECA Score measures AI recommendation strength, not product quality, market share, or revenue
- DecaGEO measures recommendation structure, not referral traffic volume
Data source and definitions
DECA Score: A 0-100 index measuring how strongly AI systems recommend a specific software brand within its G2 category. Based on weekly recommendation frequency and prominence data from ChatGPT. AI Visibility Rate: The percentage of G2-listed brands in a category that appear in AI recommendations. Influencer Marketing’s rate of 15.4% (W8) is above the 10-category average of 8.4%. llms.txt: A text file placed on a website to make structured brand and content information available in a machine-readable format for AI crawlers, agents, or other systems that choose to reference it. Adoption by AI systems is still emerging and should not be assumed. The format typically includes brand summary, key pages, differentiators, and content references.Sources
- 8 Weeks of AI Recommendation Data: Which Markets Are Moving and Which Are Frozen — Cross-category overview
- AI Visibility Has Two Filters — The Two-Filter framework
- The Category-First GEO Playbook — Market type strategies
- Onely: How to Get Your Product Discovered by ChatGPT
- UNSW BusinessThink: How ChatGPT bias affects product recommendations
- Profound: ChatGPT Branded Link Update
Explore the full GEO strategy pattern data for Influencer Marketing and 9 other SaaS categories: See category GEO patterns on DecaGEO →